Table of Contents
- Markets and Competition
- Demand
- Supply
- Supply And Demand Together
- Conclusion: How prices Allocate Resources
Markets and Competition
What Is A Market?
A market is a group of buyers and sellers of a particular good or service. Buyers decide the demand for the product while sellers decide the supply of the product.
What is Competition?
Economists use the term competitive market to describe a market in which there are so many buyers and so many sellers that each has a negligible impact on the market price.
Competition has various degrees, from perfectly competitive to monopoly.
Perfectly competitive requires two characteristics: 1. the goods offered for sale are all exactly the same 2. the buyers and sellers are so numerous that no single buyer or seller has any influence over the market price.
However, some marketplace has only one seller, such a seller is called a monopoly.
Demand
We begin our study of markets by examining the behavior of buyers. To focus our thinking, let’s keep in mind a particular good — ice cream.
The Demand Curve: The Relationship Between Price and Quantity Demand
The quantity demanded of any good is the amount of the good that buyers are willing and able to purchase. The relationship of price and quantity demanded follows the law of demand: Other things equal, when the price of a good rises, the quantity demanded of the good falls, and when the price falls, the quantity demanded rises. A table that shows the relationship between the price of a good and the quantity demanded is called demand schedule.
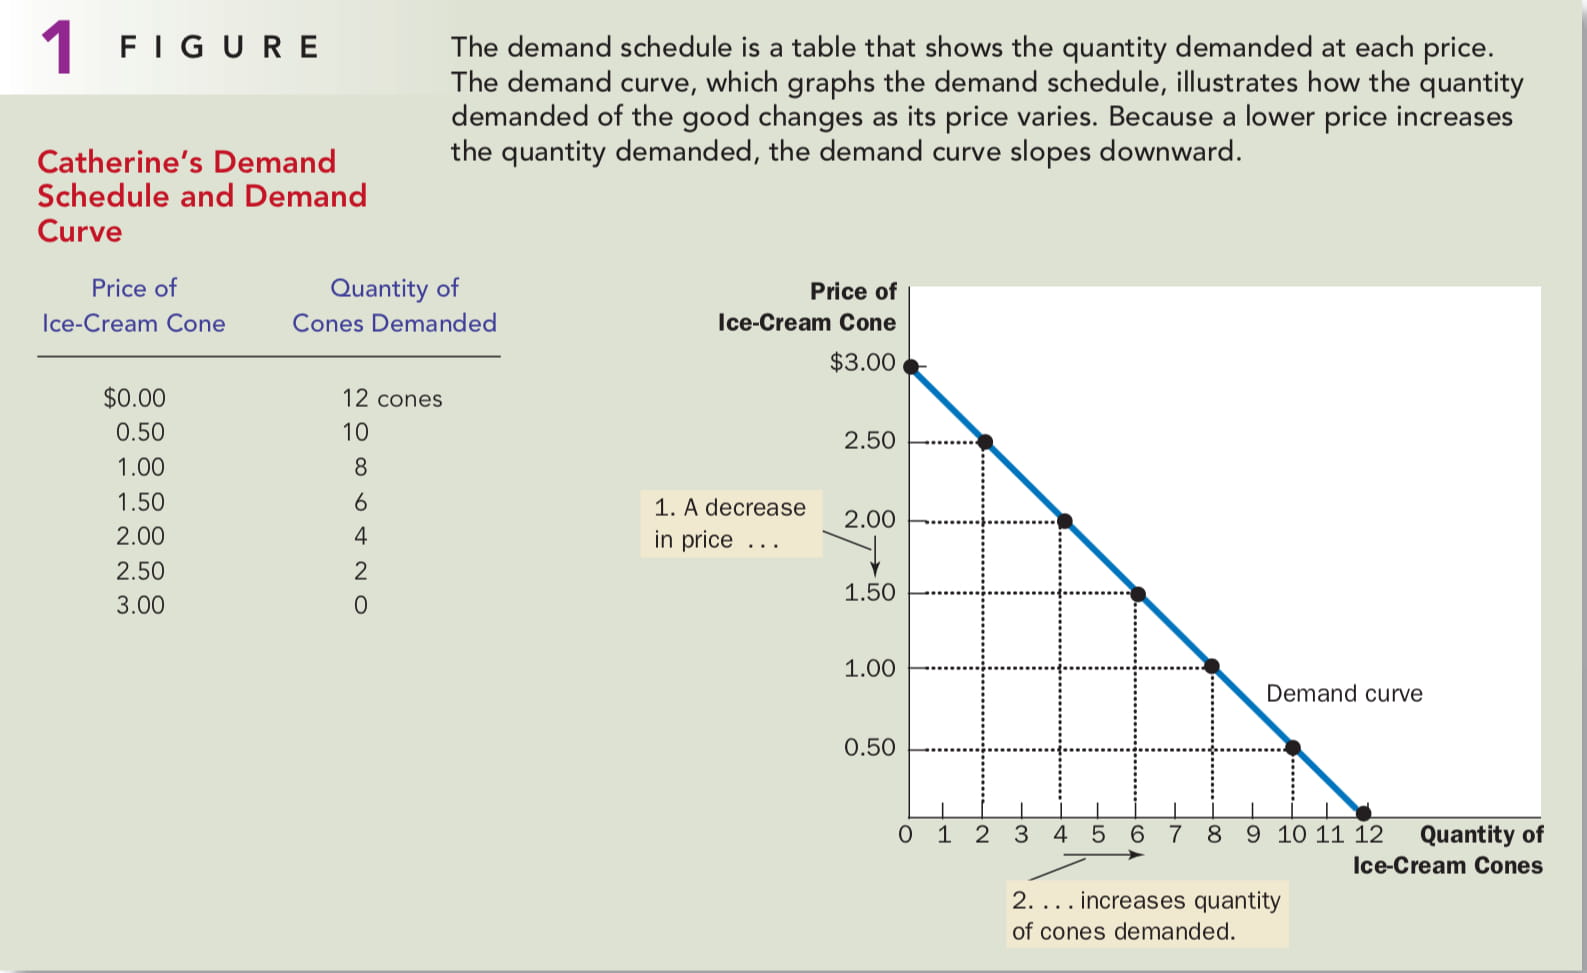
The graph in Figure 1 uses the numbers from the table to illustrate the law of demand. By convention, the quantity of ice cream demanded is on the horizontal axis. The downward-sloping line relating price and quantity demanded is called the demand curve.
Market Demand VS. Individual Demand
Figure 1 shows the individual demand of ice-cream. However, most of the time, we want to focus on the market demand which is the sum of all individual’s demands.
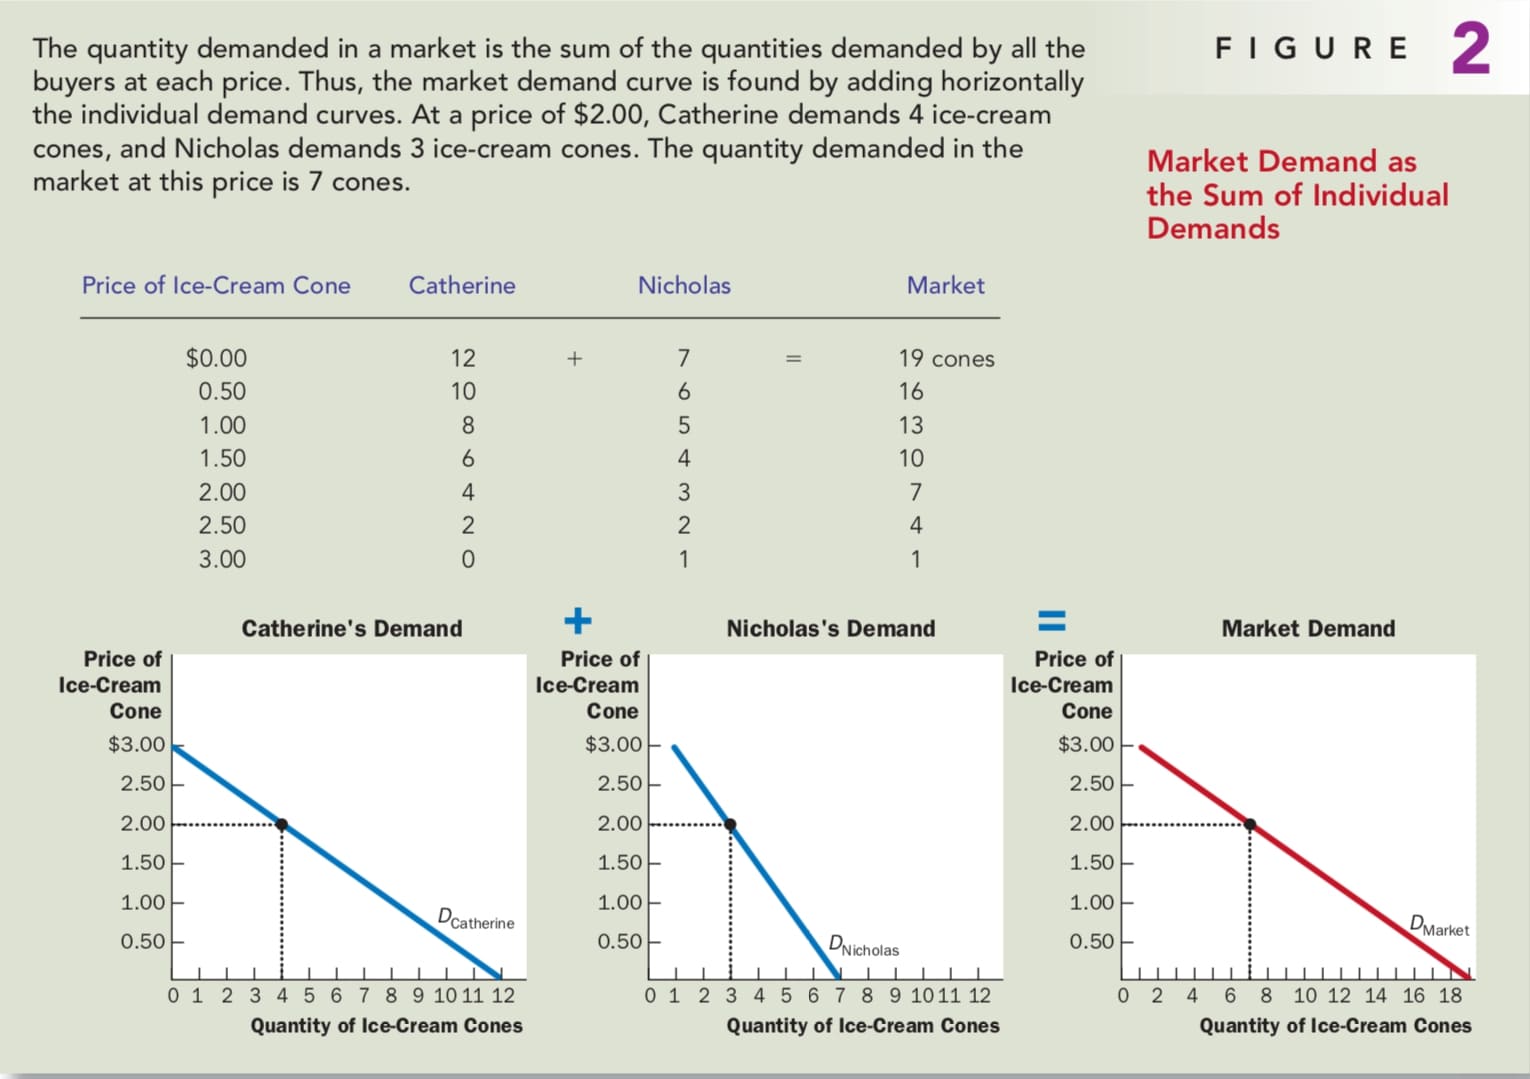
Figure 2 shows the Catherine’s demand, Nicholas’s demand as well as the market demand. At each price, the total quantity demand is the sum of Catherine’s quantity demand and Nicholas’s quantity demand. The market demand curve shows how the total quantity demanded of a good varies as the price of the good varies, while all the other factors are held constant.
Shifts In the Demand Curve
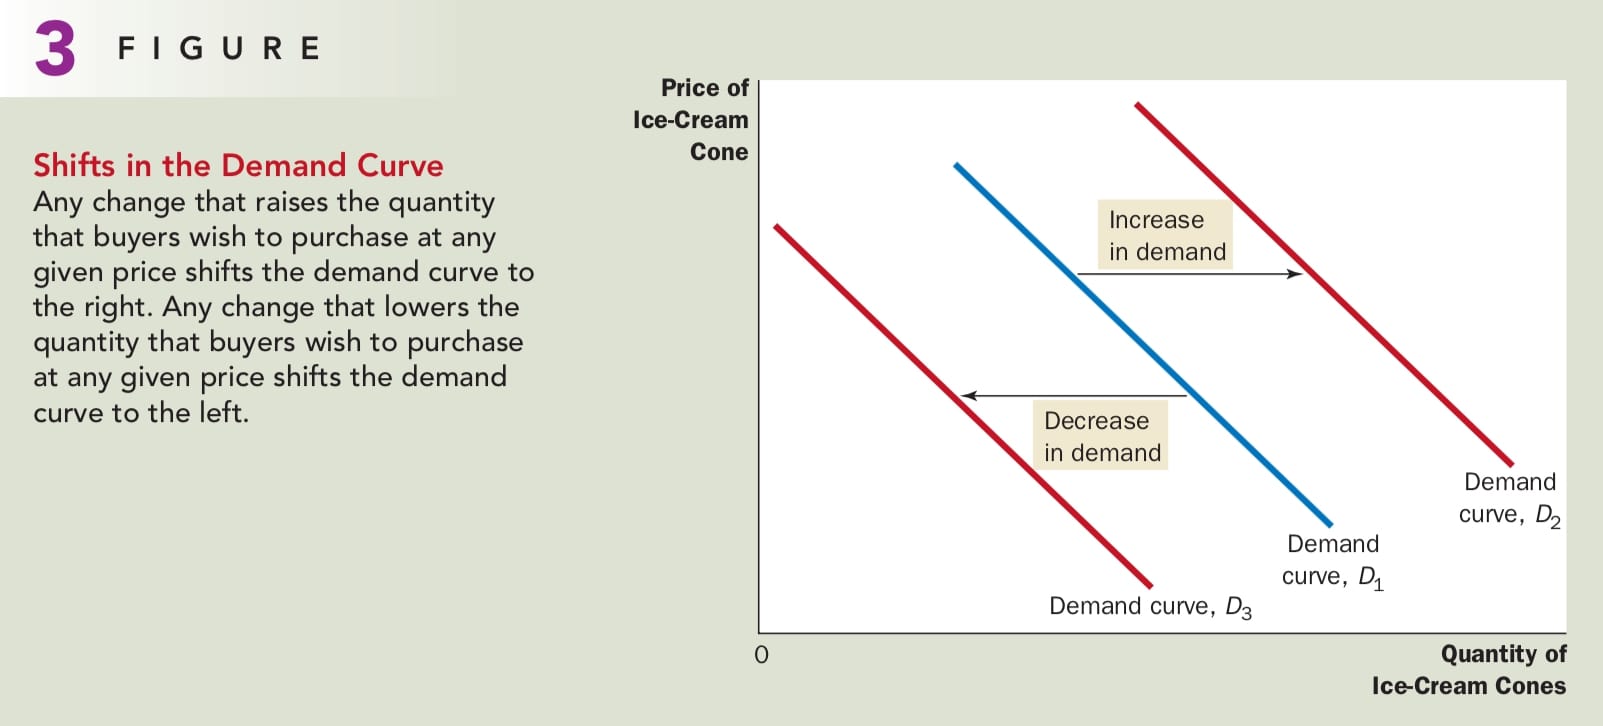
Figure 3 illustrates shifts in the demand. There are many variables that can shift the demand curve. Here are the most important.
Income If the demand for a good falls when income falls, the good is called a normal good. If the demand for a good rises when income falls, the good is called an inferior good, such as bus rides. As your income falls, you are less likely to buy a car or take a cab and more likely to ride a bus.
Prices of Related Goods When a fall in the price of one good reduces the demand for another good, the two goods are called substitutes, such as ice cream and frozen yogurt, hot dogs and hamburgers. When a fall in the price of one good raises the demand for another good, the two goods are called complements, such as gasoline and automobiles, computers and software.
Tastes If you like ice cream, you buy more of it. Economists examine what happens when tastes change.
Expectations Your expectations about the future may affect your demand for a good or service today.
Number of Buyers Market demand depends on the number of buyers.
Summary 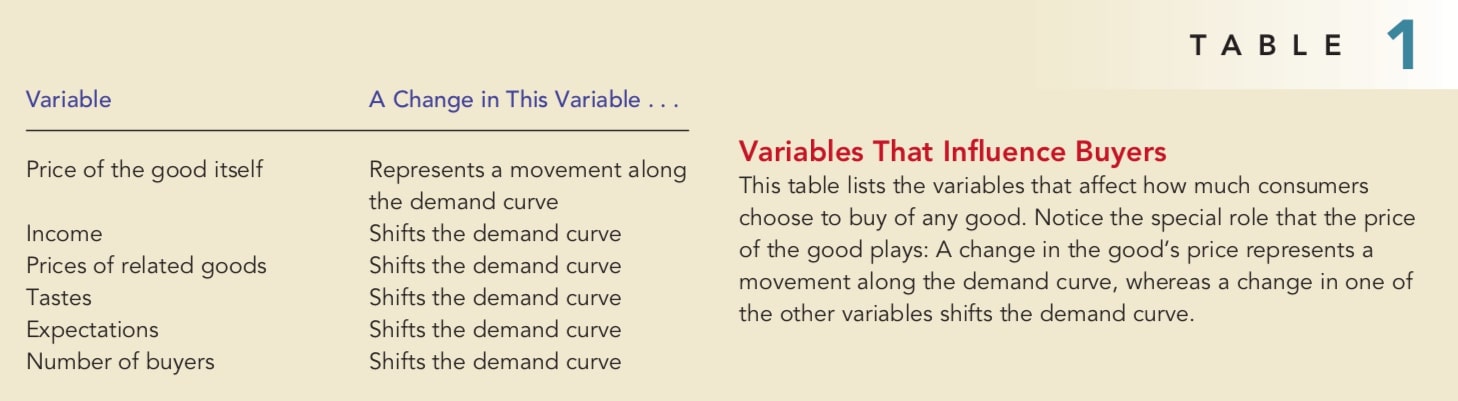
Supply
We now turn to the other side of the market and examine the behavior of sellers. Once again, to focus our thinking, let’s consider the market for ice cream.
The Supply Curve: The Relationship Between Price and Quantity Supplied
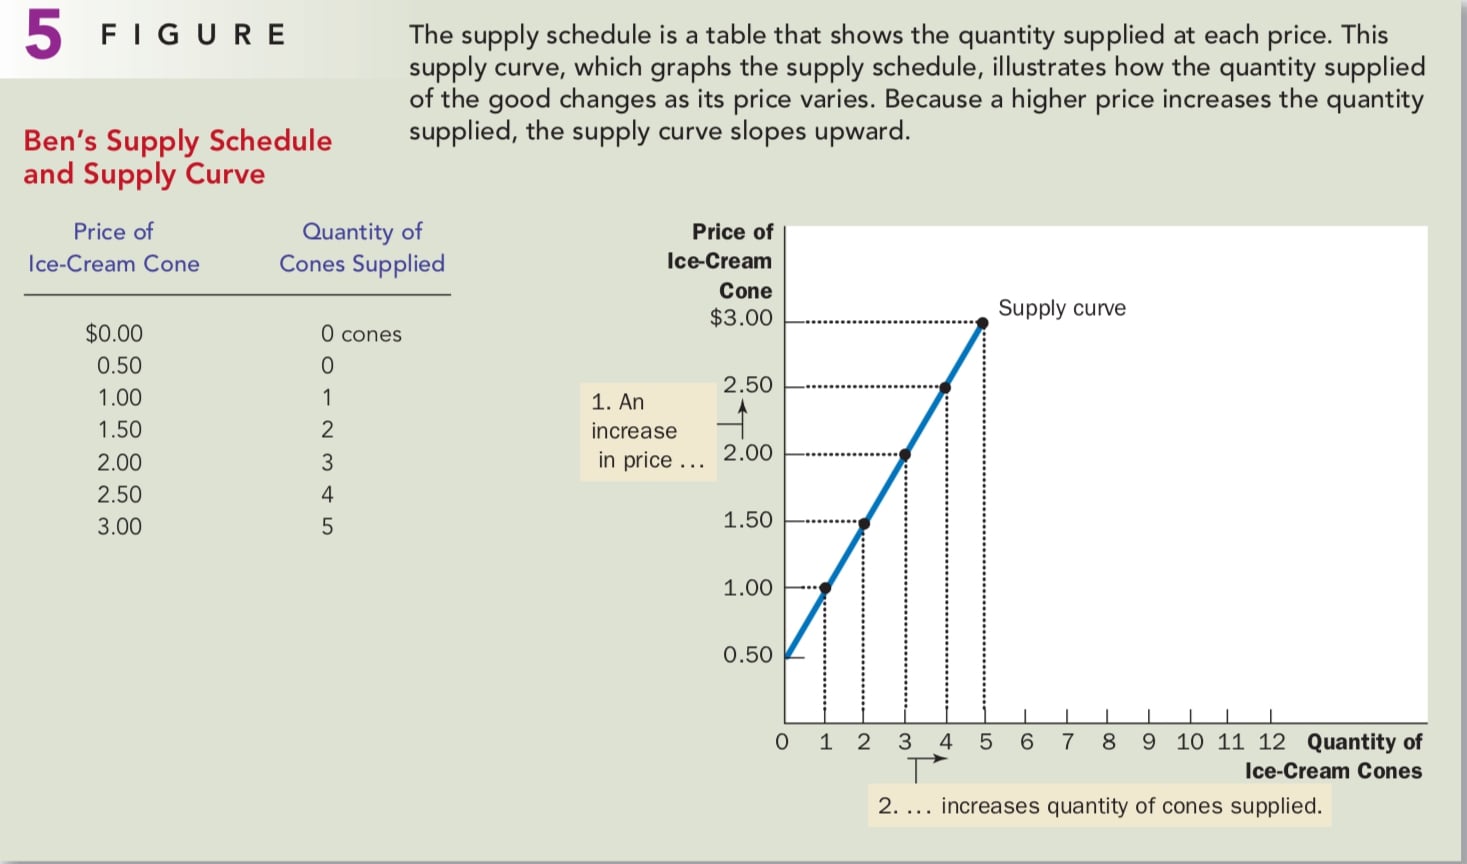
Quantity supplied is the amount of a good that sellers are willing and able to sell. When other things equal, the quantity supplied of a good rises when the price of the good rises, which is called the law of supply.
Supply schedule is a table that shows the relationship between the price of a good and the quantity supplied. The curve relating price and quantity supplied is called the supply curve.
Market Supply VS. Individual Supply
Just as market demand is the sum of the demands of all buyers, market supply is the sum of the supplies of all sellers. As with demand curves, we sum the individual supply curves horizontally to obtain the market supply curves. 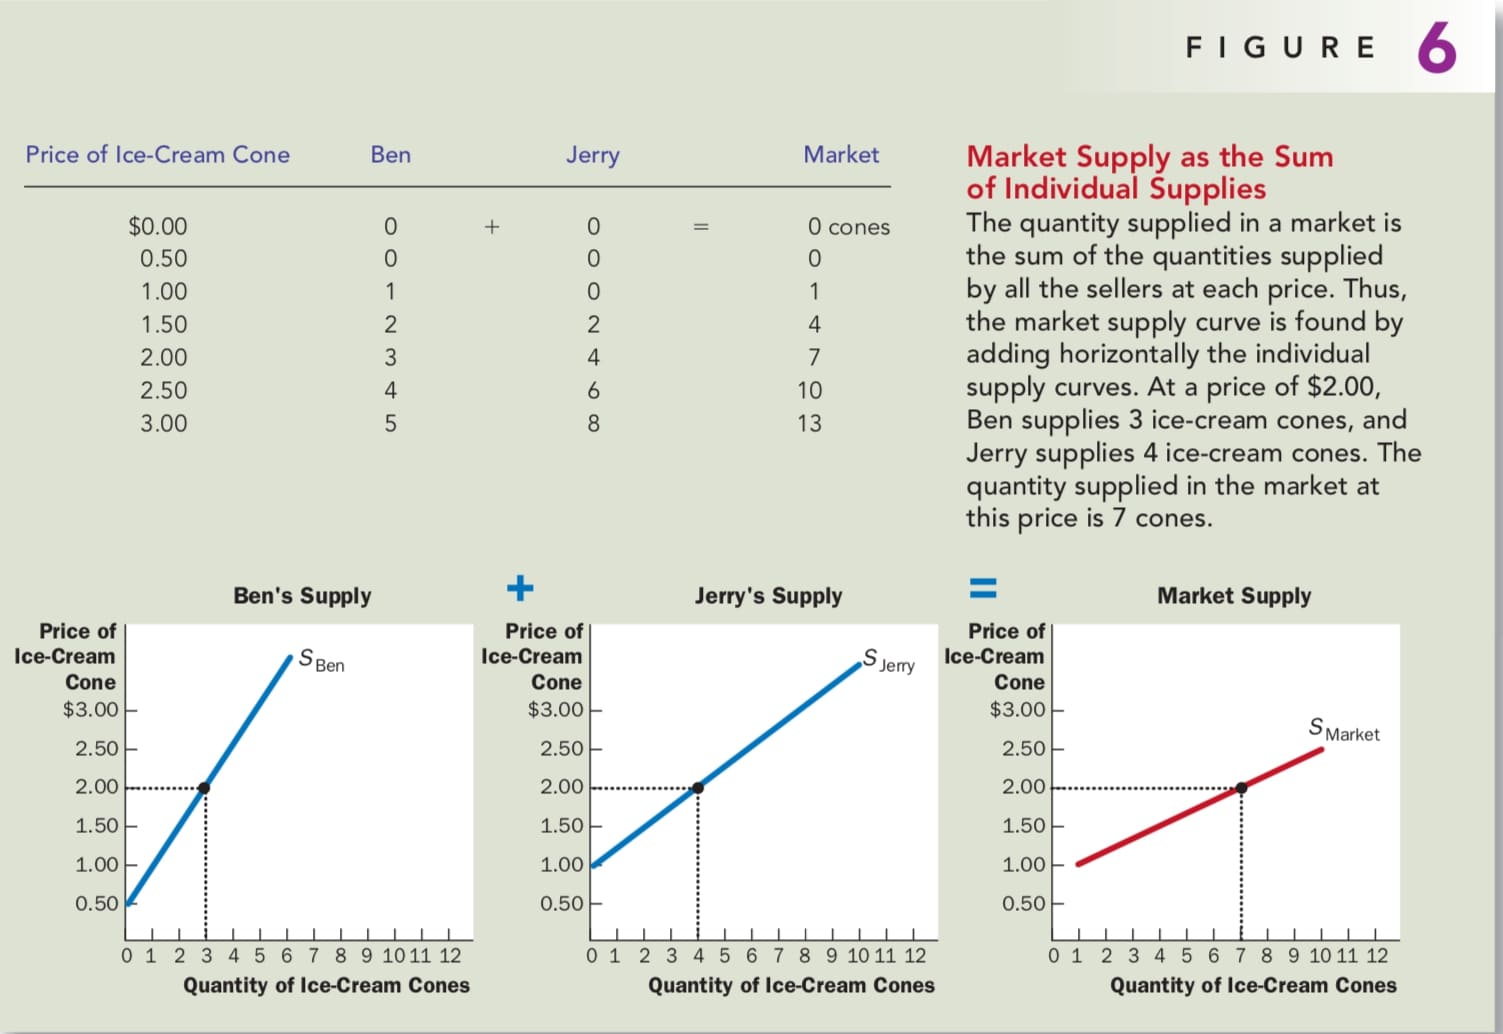
Shifts In The Supply Curve
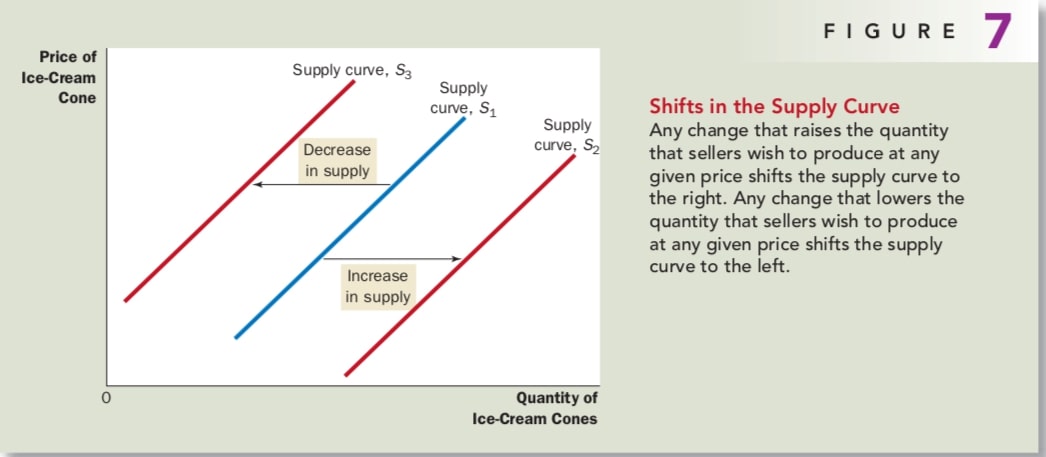
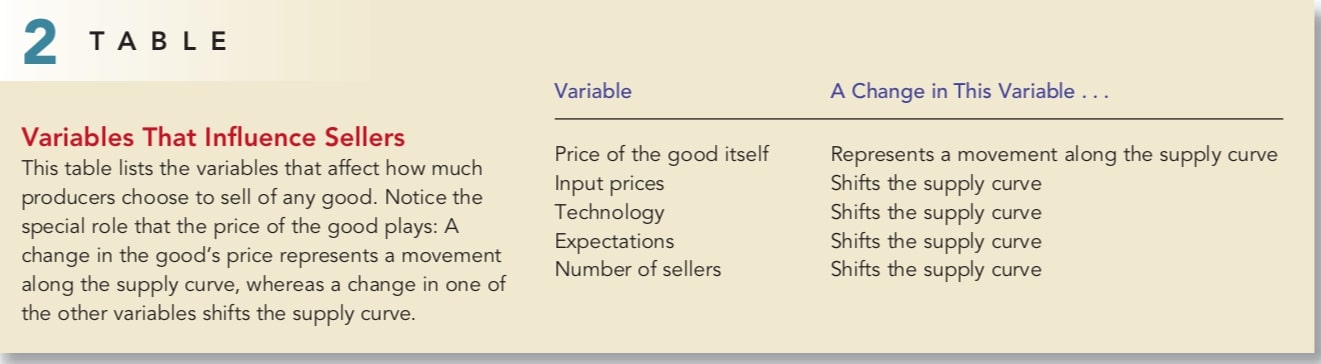
Figure 7 illustrate shifts in the supply curve. There are many variables that can shift the supply curve. Here are some of the most important.
Input Prices When the price of one or more inputs rises, producing the good is less profitable, and firms supply less the good.
Technology By reducing firms’ costs, the advanced technology raised the supply of goods.
Expectations The amount of good a firm supplies today may depend on its expectations about the future.
Number of Sellers In addition to the preceding factors, which influence the behavior of individual sellers, market supply depends on the number of these sellers.
Summary
Supply And Demand Together
Equilibrium
Figure 8 shows the market supply curve and market demand together. The intersection point is called equilibrium. Equilibrium is a situation in which the market price has reached the level at which quantity supplied equals quantity demanded. The price that balances quantity supplied and quantity demanded is called equilibrium.
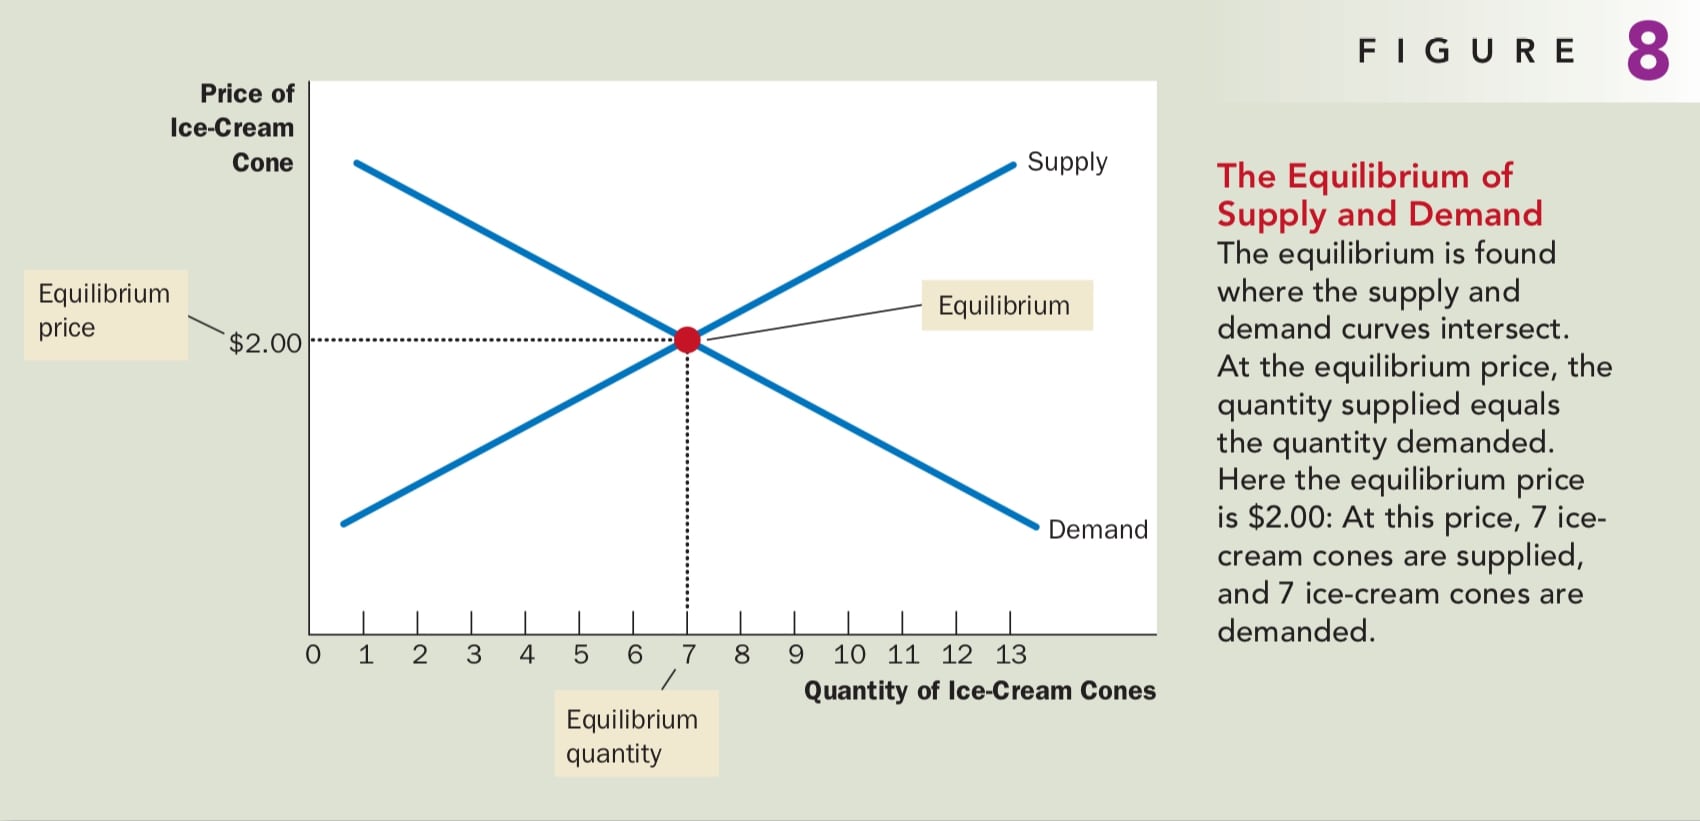
At the equilibrium price, the quantity of the good that buyers are willing and able to buy exactly balances the quantity that sellers are willing and able to sell. The actions of buyers and sellers naturally move markets toward the equilibrium of supply and demand.
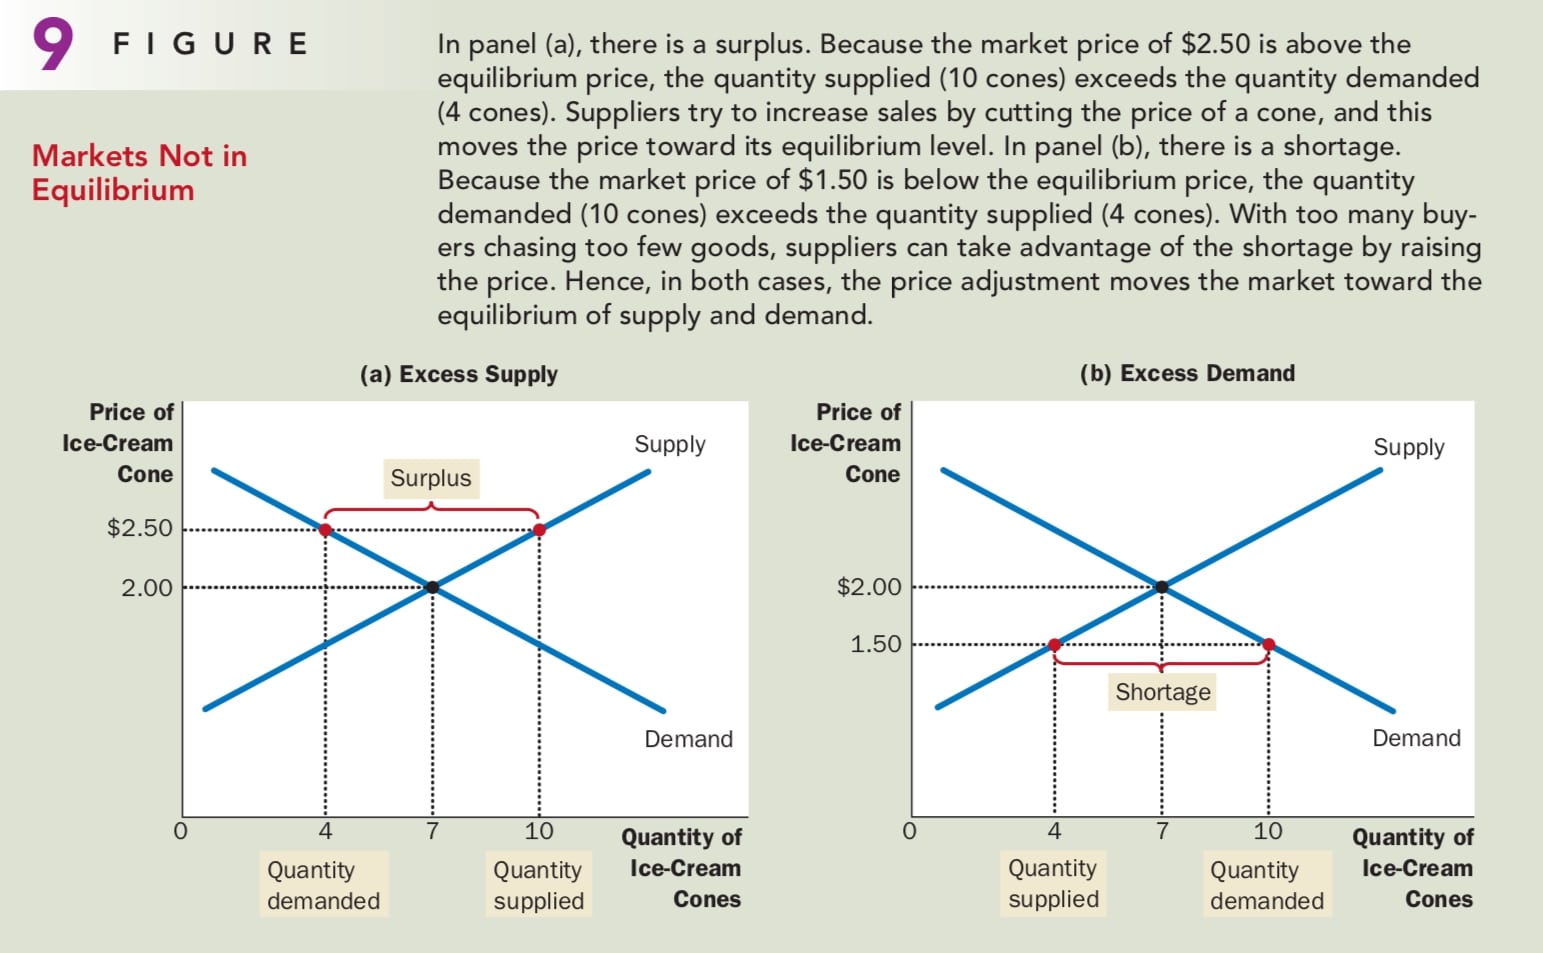
Law of supply and demand: The price of any good adjusts to bring the quantity supplied and the quantity demanded for that good into balance.
Three Steps To Analyzing Changes In Equilibrium
- Decide whether the event shifts the supply or demand curve (or perhaps both).
- Decide in which direction the curve shifts.
- Use the supply-and-demand diagram to see how the shift changes the equilibrium price and quantity.
Example 1:

In the ice-cream example, supply (which refers to the position of the supply curve) does not change because the weather does not alter firms’ desire to sell at any given price. Instead, the hot weather alters consumers’ desire to buy at any given price and thereby shifts the demand curve to the right. The increase in demand causes the equilibrium price to rise. When the price rises, the quantity supplied rises. This increase in quantity supplied is represented by the movement along the supply curve.
Example 2: Shifts in Both Supply and Demand
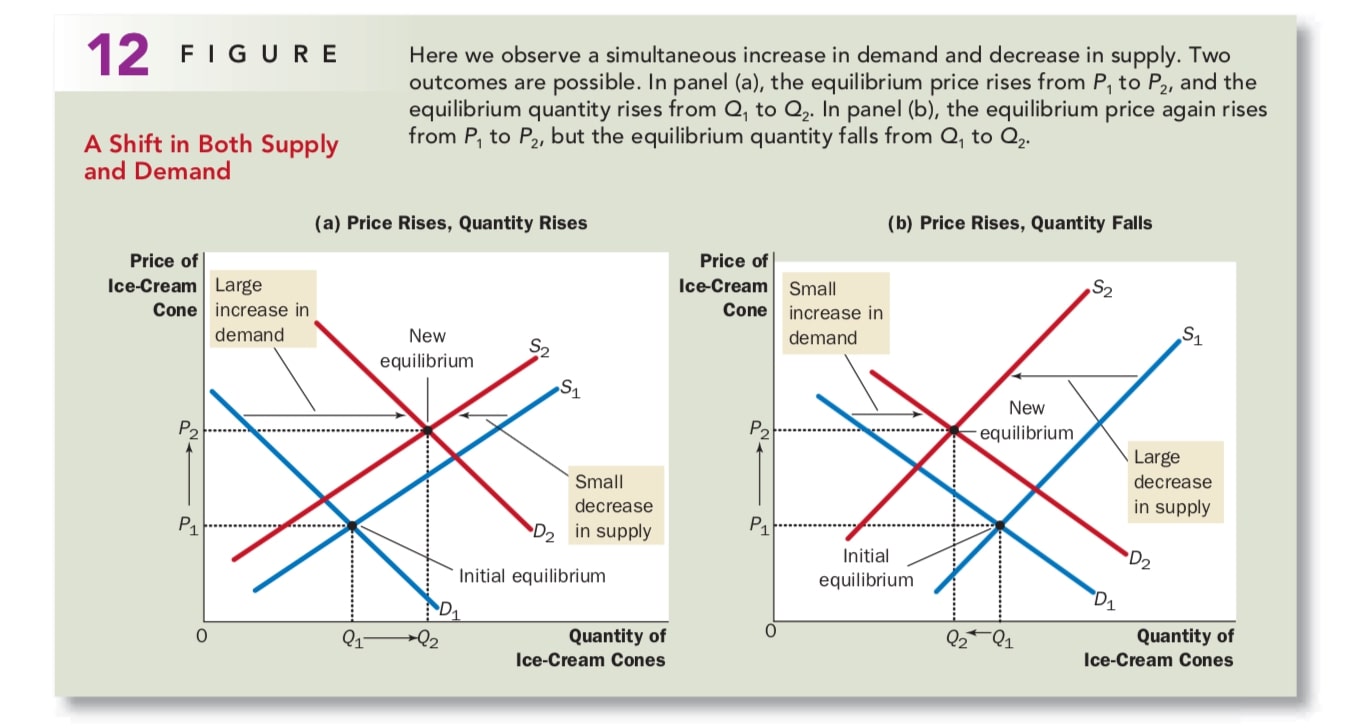
Summary
Conclusion: How prices Allocate Resources
Consider the allocation of beachfront land. Because the amount of this land is limited, not everyone can enjoy the luxury of living by the beach. Who gets this resource? The answer is whoever is willing and able to pay the price. The price of beachfront land adjusts until the quantity of land demanded exactly balances the quantity supplied. Thus, in market economies, prices are the mechanism for rationing scarce resources.
Similarly, prices determine who produces each good and how much is produced. If an invisible hand guides market economies, as Adam Smith famously suggested, then the price system is the baton that the invisible hand uses to conduct the economic orchestra.